Monday, December 12, 2011
Lion on Dell Optiplex 755
Monday, November 14, 2011
Custom Markers to a Line, Scatter, or Bubble Chart in Excel
Apply Custom Markers to a Line, Scatter, or Bubble Chart

Read more:Custom Excel Chart Series Markershttp://peltiertech.com/Excel/ChartsHowTo/CustomMarkers.html#ixzz1dhfx9aED
Tuesday, November 1, 2011
excel boxplot or box plot

ebook website
书山有径,一网无涯,不敢独享,欢迎补充!
Ebook Search Engine:
http://ebookee.org/
http://library.nu/
http://inkmesh.com/
http://fliiby.com/
http://ishare.iask.sina.com.cn/
http://pm.upblog.net/books.html
Free ebook sites:
*经典pdf
http://www.planetpdf.com/free_pdf_ebooks.asp?CurrentPage=1&rhs
*各类杂志 (new)
http://ireadingnow.com
*子乌书简
http://book.zi5.me/
* Dropbox
http://www.dropbox.com/s/b44t0swhzsdlaof
* 苹果读书
http://ibook.178.com/
* 理工类书籍
http://bib.tiera.ru/static
* 百年千书
http://wp.1000ebooks.tw/
* O'REILLY Open Books
http://oreilly.com/openbook/
* PlanetPDF: Classics works of Literature.
http://www.planetpdf.com/free_pdf_ebooks.asp?CurrentPage=1
* University of California, eScholarship Edition: The eScholarship Editions collection includes almost 2000
books from academic presses on a range of topics, including art, science, history, music, religion, and
fiction.
http://content.cdlib.org/escholarship/
* University of Adelaide Library’s collection of Web books:
The collection includes classic works of Literature, Philosophy, Science, and History.
http://etext.library.adelaide.edu.au/
* AvaxHome.ru: Some new ebooks. Rapidshare download links. Copyright is a problem.
http://www.avaxhome.ru
* The National Academies Press: Read more than 3,000 books online FREE!
http://www.nap.edu
* Free ebooks, magazines, newspapers, and many others
http://www.asiaing.com
* PSU's Electronic Classics Site
http://www2.hn.psu.edu/faculty/jmanis/jimspdf.htm
* The Online Books Page (hosted by the University of Pennsylvania Library)
http://onlinebooks.library.upenn.edu/
* 好书下载(台湾的一个网站)
http://sites.google.com/site/myboooksindex/
* http://www.epubbooks.com/
* mobileme (原版书籍)
https://public.me.com/chen_zihua
* dbank (中文mobi)
http://dl.dbank.com/c0sicsy5on
* 读览天下 (杂志)
http://www.dooland.com/kindle/
* COAY
http://www.coay.com/index.php
* 金读
http://kindle.im/
* 苦瓜书盘
http://kgbook.com/
* 亿年书海
http://www.inien.com/w/#/Index
* 掌上书苑
http://www.cnepub.com/
* 书仓
http://www.shucang.com/index.php
* 电子书城
http://www.chnxp.com.cn/sitemap.html
* 网上阅读
http://www.ifanshu.com/
*优盘pdfgaf共享文件夹
http://u.115.com/folder/f2c2e87cb7/
* txt书籍
http://www.txtshuji.com/
http://www.duoduomi.com/
* 中文epub
http://ibook.178.com/
* seakye's SkyDrive
http://cid-ab536aff86b227d2.skydrive.live.com/home.aspx
http://link.live.net/?l=http%3A%2F%2Fwww.mediafire.com%2Fseakye
US&h=Xn63ly6G&o=AB536AFF86B227D2%212644&u=AB536AFF86B227D2
*经史子集
http://book.godist.cn/
* The Burgomeister's Books (Over 1700 Books: Kindle-ready)
http://truly-free.org/kindle-ready.php
*好讀網站 (制作精良的繁体书库,强烈推荐其「二十世紀中文小說一百強」)
http://www.haodoo.net/
*七彩英语 (2000多本英文原版书籍)
http://www.qcenglish.com/
* amazon free books
http://www.amazon.com/b?ie=UTF8&node=2245146011
*google books (over 1 million Full view downloadable books in pdf and/or
epub)
http://books.google.com/
*Project Gutenberg (over 33,000 free ebooks)
http://www.gutenberg.org/wiki/Main_Page
*Feedbooks ( great collection of well-formatted books)
http://www.feedbooks.com/
*Manybooks (over 28,000 titles)
http://manybooks.net//
Friday, October 28, 2011
Mac OS X(86): Time Synchronization with Windows Dual Boot
| Mac OS X(86): Time Synchronization with Windows Dual Boot |  |  |
Description:
There is a minor problem on native installs of Mac OS X and Mac OSx86 Tiger and Leopard where after booting OS X, if you boot Windows your time is completely out of sync. This article describes how to fix these problems
**********
As you read in the description, this annoying problem is due to the fact that OS X syncs time differently from Windows and it causes things to get confusing. Before doing any of these fixes, go into OS X, manually set the time and the correct time zone. Then boot into Windows, and set the time correct and proceed. Here are a few fixes for this annoying issue that will hopefully fix this:
Easy Installer Method (Best solution - Permanent fix)
AppleTime.exe method
Timesync.bat method for ethernet modems and routers
Use this method if you have an always on ethernet modem and router
Timesync.bat method for USB modems and routers
Use this method if you have a USB modem or router that is not always on
Registry edit method
GMT Workaround
|
Friday, October 21, 2011
every time I boot Lion I have to wait approximately 10 minutes for my USB keyboard and mouse to function
I was able to get Lion GM installed. However, every time I boot I have to wait approximately 10 minutes for my USB keyboard and mouse to function. My mouse will move but I cannot click on anything. In searching in the logs, I found that as soon as I get control of my peripherals, this notice occurs: Timeout waiting for IOKit to be quiet.
I have tried so many things, but at this point I am open to anything even if I have already tried it.
---------
OK, just spent some time troubleshooting an odd problem I have had since I installed OS X Lion. The symptoms:
* When I boot,
* If set to boot to desktop, gets there but the mouse and
keyboard do not seem to work for about 10 minutes - except
the mouse pointer will move. No clicks or button presses
work, though. Then all is fine.
* If set to go to login screen, gets there and does the same
thing - then once I can log in all is fine.
* Does the same thing if I boot with Option and then go to
the Recovery "drive"
After the 10 minutes, though, all seems fine. After much troubleshooting, this is what I found (with the help of a *wonderful* Apple tech):
First: I use a Logitech MX518 (8 button mouse) with a third party driver (SteerMouse). I also have an Apple mouse and a Logitech 3 button mouse with the label missing - I just looked at the Logitech site and did not see it listed there any more. So be it: I will just call it the Logitech 3B.
The above symptoms happen under the following conditions:
* SteerMouse installed: if the Logitech MX518 or the Logitech
3B attached. Either way, 10 minute delay. All is fine with
the Apple mouse.
* SteerMouse *not* installed: if the Logitech MX518 is
attached but *not* if the Logitech 3B is attached (or the
Apple mouse)
My guess: Apple made changes to the way input devices work with Lion (clearly they added gestures and the like). I wonder how long until others start reporting similar oddities - and how long until Apple corrects this.
Thursday, August 18, 2011
Film Characteristics
INTRODUCTION AND OVERVIEW | |
Contrast is perhaps the most significant characteristic of an image recorded on film. Contrast is the variation in film density (shades of gray) that actually forms the image. Without contrast there is no image. The amount of contrast in an image depends on a number of factors, including the ability of the particular film to record contrast.
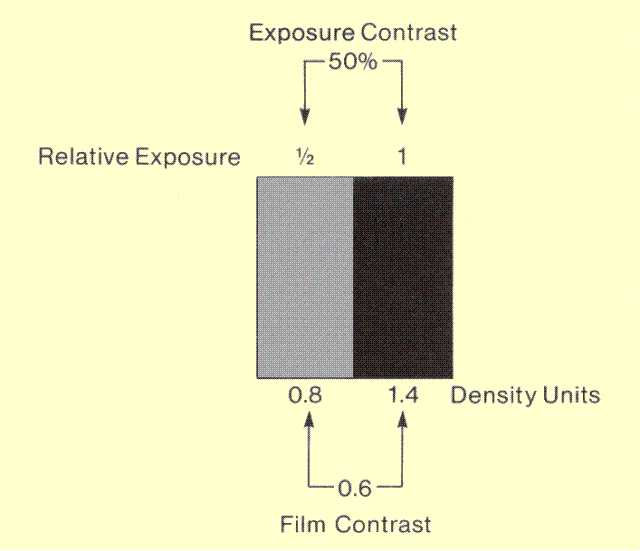
The exposure contrast between two areas can be expressed as a ratio or percentage difference, as illustrated above. The film contrast between two areas is expressed as the difference between the density values. The ability of the film to convert exposure contrast into film contrast can be expressed in terms of the contrast factor. The value of the contrast factor is the amount of film contrast resulting from an exposure contrast of 50%. The amount of contrast produced by medical imaging films depends on four basic factors:
In this section we consider the basic contrast characteristics of film, how these characteristics are affected by the factors listed above, and how contrast characteristics relate to clinical applications.
| |
CONTRAST TRANSFER | |
The ability of a film to produce contrast can be determined by observing the difference in density between two areas receiving a specified difference in exposure, as shown in the figure above. However, since the amount of contrast is affected by the level of exposure, a range of exposure values must be delivered to a film to demonstrate fully its contrast characteristics.
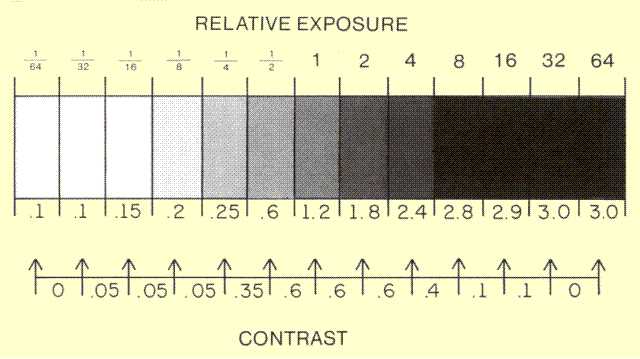
One method of doing this is illustrated in the following figure; this type of exposure pattern is usually produced by a device known as a sensitometer. In this method, a strip of film is divided into a number of individual areas, and each area is exposed to a different level of radiation. In this particular illustration, the exposure is changed by a factor of 2 (50% contrast) between adjacent areas. When considering contrast characteristics, we are usually not interested in the actual exposure to a film but rather the relative exposure among different areas of film. In the figure below the exposures to the different areas are given relative to the center area, which has been assigned a relative exposure value of 1. We will use this relative exposure scale throughout our discussion of film contrast characteristics. Note that each interval on the scale represents a 2:1 ratio. This is a characteristic of a logarithmic scale. When the film is processed, each area will have density values, as shown directly below the area. The amount of contrast between any two adjacent areas is the difference in density, as shown. In this illustration we can observe one of the very important characteristics of film contrast. Notice how the contrast is not the same between each pair of adjacent areas throughout the exposure range: there is no contrast between the first two areas, but the contrast gradually increases with exposure, reaches a maximum, and then decreases for the higher exposure levels. In other words, a specific type of film does not produce the same amount of contrast at all levels of exposure. This important characteristic must be considered when using film to record medical images.
All films have a limited exposure range in which they can produce contrast: if areas of a film receive exposures either below or above the useful exposure range, contrast will be diminished, or perhaps absent. Image contrast is reduced when a film is either underexposed or overexposed.
| |
The Characteristic Curve | |
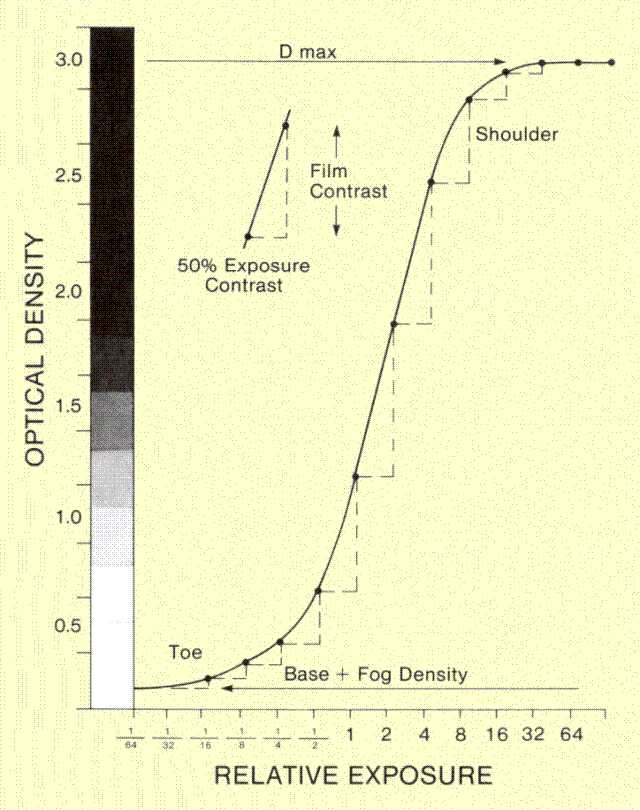
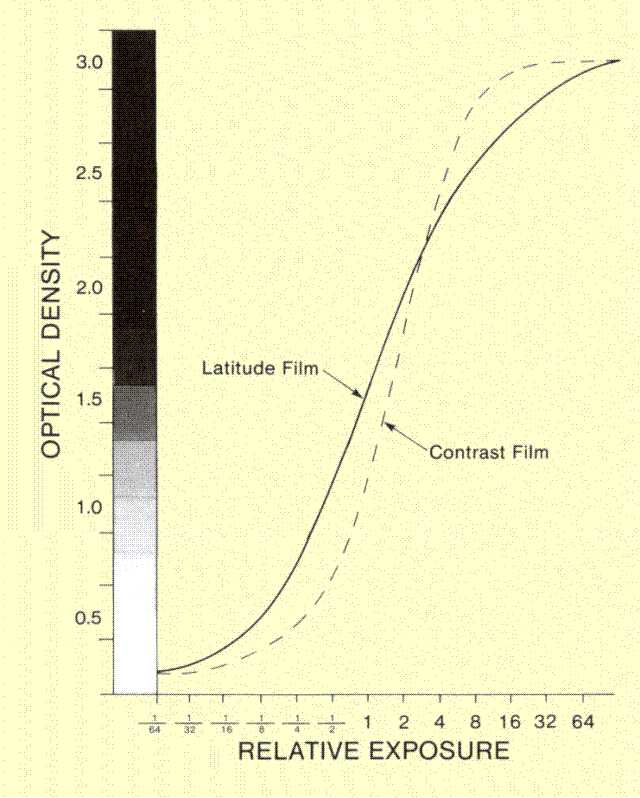
The relationship between film density and exposure is often presented in the form of a graph, as shown below. This graph shows the relationship between the density and relative exposure for the values shown above. This type of graph is known as either a film characteristic curve or an H and D (Hurter and Driffield) curve. The precise shape of the curve depends on the characteristics of the emulsion and the processing conditions. The primary use of a characteristic curve is to describe the contrast characteristics of the film throughout a wide exposure range. At any exposure value, the contrast characteristic of the film is represented by the slope of the curve. At any particular point, the slope represents the density difference (contrast) produced by a specific exposure difference. The same interval anywhere on the relative exposure scale represents the same exposure ratio and amount of contrast delivered to the film during the exposure process. An interval along the density scale represents the amount of contrast that actually appears in the film. The slope of the characteristic curve at any point can be expressed in terms of the contrast factor because the contrast factor is the density difference (contrast) produced by a 2:1 exposure ratio (50% exposure contrast).
A film characteristic curve has three distinct regions with different contrast transfer characteristics. The part of the curve associated with relatively low exposures is designated the toe, and also corresponds to the light or low-density portions of an image. When an image is exposed so that areas fall within the toe region, little or no contrast is transferred to the image. In the film shown in the figure in the previous paragraph, the areas on the left correspond to the toe of the characteristic curve.
A film also has a reduced ability to transfer contrast in areas that receive relatively high exposures. This condition corresponds to the upper portion of the characteristic curve in which the slope decreases with increasing exposure. This portion of the curve is traditionally referred to as the shoulder. In the figure in the previous paragraph the dark areas on the right correspond to the shoulder of the characteristic curve. The two significant characteristics of image areas receiving exposure within this range are that the film is quite dark (dense) and contrast is reduced. In many instances, image contrast is present that cannot be observed on the conventional viewbox because of the high film density. This contrast can be made visible by viewing the film with a bright "hotlight."
The highest level of contrast is produced within a range of exposures falling between the toe and the shoulder. This portion of the curve is characterized by a relatively straight and very steep slope in comparison to the toe and shoulder regions. In most imaging applications, it is desirable to expose the film within this range so as to obtain maximum contrast.
The minimum density, in the toe, is the residual density, which is observed after processing unexposed film, and is typically in the range of 0.1 to 0.2 density units. This density is produced by the inherent density of the film base material and the low-level fog in the film emulsion; it is therefore commonly referred to as the base plus fog density. The maximum density, in the shoulder, is determined by the design of the film emulsion and the processing conditions and is typically referred to as the Dmax.
| |
Contrast Curve | |
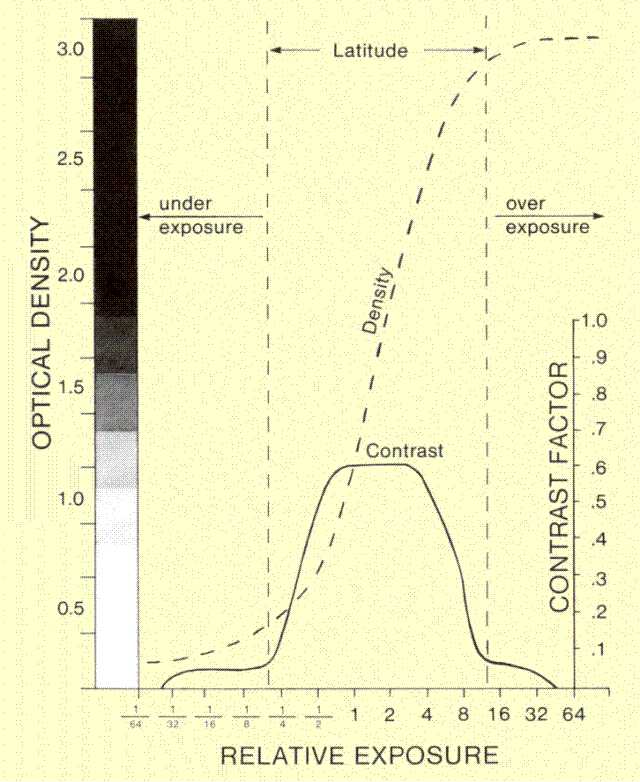
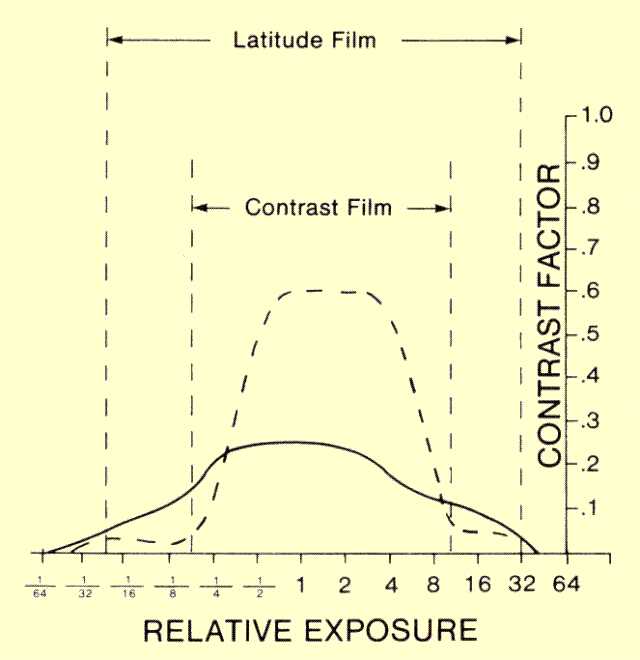
It is easier to see the relationship between film contrast and exposure by using a contrast curve, as shown below. The contrast curve corresponds to the slope of the characteristic curve. It clearly shows that the ability of a film to transfer exposure contrast into film contrast changes with exposure level, and that maximum contrast is produced only within a limited exposure range.
The exposure range over which a film produces useful contrast is designated the latitude. An underexposed film area contains little or no image contrast. Exposure values above the latitude range also produce areas with very little contrast and have the added disadvantage of being very dark or dense.
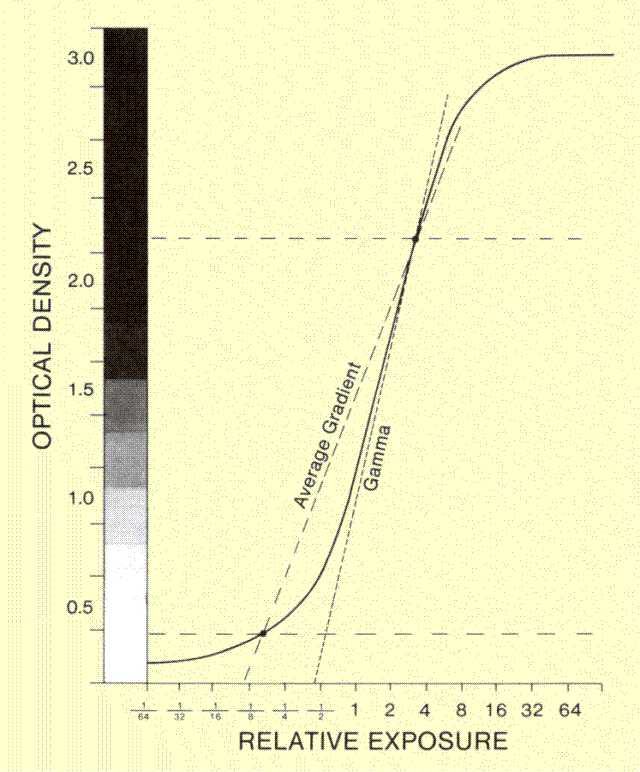
Since the contrast transfer characteristics of film change with exposure, a specific film characteristic can be described only by using either a characteristic curve or contrast curve, as illustrated above. There are occasions, however, when it would be desirable to use a single-parameter value to describe the general contrast characteristics of a film. Two parameters are often used for this purpose: The average gradient expresses the average contrast transferring ability; and the gamma expresses the maximum contrast.
| |
Gamma | |
The gamma value of a film is the maximum slope of the characteristic curve, as shown below. By tradition, the gamma value is the slope expressed in terms of the density difference associated with an exposure ratio of 10:1. The relationship between the film gamma value and the maximum contrast factor is given by: Gamma = 3.32 x Maximum contrast factor. The factor 3.32 converts a slope based on an exposure ratio of 2:1 to a slope expressed with respect to a 10:1 exposure ratio.
| |
Average Gradient | |
The average gradient is the average slope between two designated density values, as illustrated above. For medical imaging film the density values of 0.25 and 2.0 above the base plus fog density are used to determine average gradient. Average gradient values, like gamma values, are based on an exposure ratio of 10:1. The relationship between the average gradient and the average contrast factor is therefore: Average gradient = 3.32 x Average contrast factor.
| |
FILM LATITUDE | |
In the figure titled, "The Relationship of Film Contrast (Solid Line) to Relative Exposure and the Characteristic Curve (Dotted Line)" above, we saw that film contrast is limited to a specific range of exposure values. The exposure range in which a film can produce useful contrast is known as its latitude. The latitude of a specific film is determined primarily by the composition of the emulsion and, to a lesser extent, by processing conditions. The significance of film latitude is that it represents the limitations of the exposure range that will yield useful image contrast. Film latitude corresponds to the more general characteristic of dynamic range that is used for digital imaging systems. The exposure to any given area of a film falls within one of three general ranges, as shown in the figure referenced in the previous paragraph. Two general conditions can cause film exposure to fall outside the latitude range: an incorrect exposure setting of the equipment, which can produce either an underexposure or an overexposure, and an anatomical structure, which produces a wide range of exposure values within an image that exceed the latitude range.
| |
Exposure Error | |
In every imaging procedure it is necessary to set the exposure to match the sensitivity (speed) of the film being used. This is not always an easy task. It is not always possible to predict the amount of x-ray exposure required in every procedure because of subtle variations in body size and composition. In any radiographic practice, a significant number of films must be repeated because of exposure error.
| |
Subject Contrast Range | |
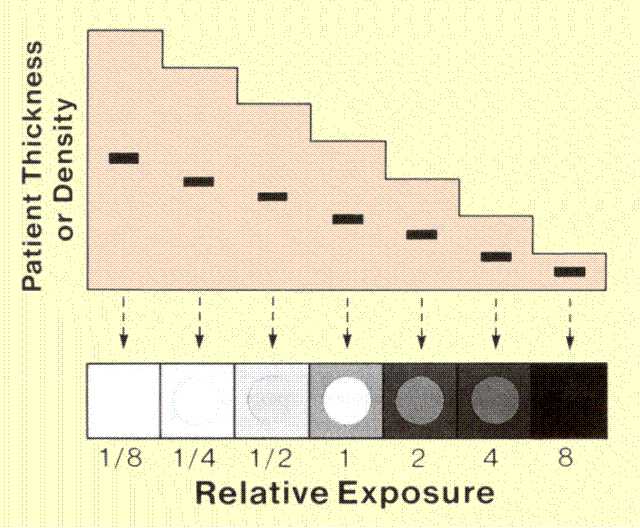
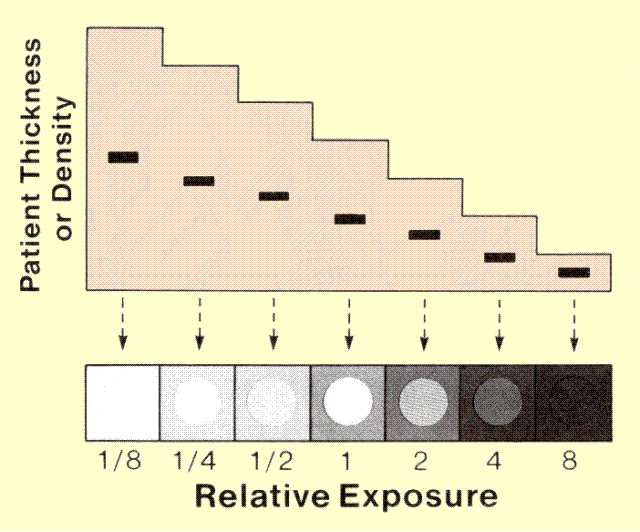
When an x-ray beam passes through certain body areas, the penetration of the areas varies considerably because of differences in tissue thickness and composition. Under these conditions it is possible for the range of exposures from the patient's body (subject contrast range) to exceed the latitude of the film. This typically produces a high level of area contrast, as discussed in a previous chapter. When the exposure to some image areas falls outside the film latitude, details within the areas are recorded with reduced contrast, as illustrated below. Notice that the objects located within the very thick and thin body sections are not recorded because they are located in areas outside the film latitude. Radiography of the chest illustrates this problem: the area of the medistimum receives a relatively low exposure whereas the lung areas receive a much higher level.
One possible solution to the problem is to decrease the subject contrast range by using increased KV, spatial filtration, bolus, or compression. Another possible solution is to use a film with a longer latitude.
| |
FILM TYPES | |
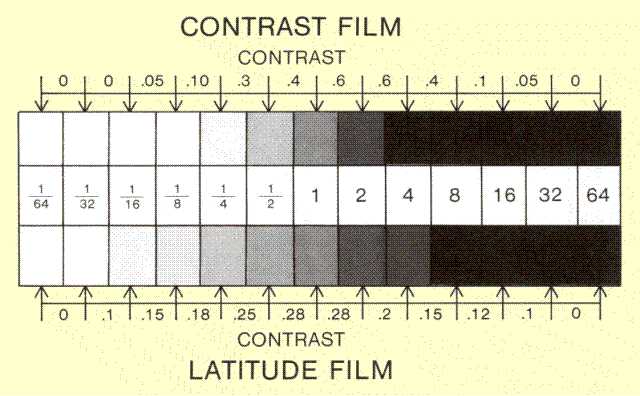
The overall contrast characteristic of a film (shape of characteristic curve and latitude) is determined by the composition of the emulsion. Radiographic film is usually designated as either high contrast or medium contrast film. Medium contrast film is often referred to as latitude film.
The following figure illustrates how using a medium contrast, or latitude, film actually increases object contrast within certain areas because of the overall reduction in area contrast.
| |
EFFECTS OF PROCESSING | |
Both the sensitivity and the contrast characteristics of a given film type are affected by processing. The degree of processing received by film generally depends on three factors: (1) the chemical activity of the developer solution, (2) the temperature of the developer, and (3) the period of immersion in the developer. In most applications it is usually desirable to maintain a constant developer activity by replenishment and to control the degree of development by varying the temperature or, in some cases, the amount of development time. Varying the amount of development by changing either the chemical activity, the time period, or the temperature produces a shift in the characteristic curve.
The optimum performance of most film types is obtained by using the recommended degree of development. Deviation in either direction generally results in a loss of contrast. Although the sensitivity of film can usually be increased by overdeveloping, this is usually accompanied by an increase in undesirable fog.
| |
Over Processing | |
Increasing development will cause the curve to shift to the left with a rise in the toe. The movement of the curve to the left indicates an increase in sensitivity because a given density value is produced with a lower exposure. As the toe of the curve rises, the general slope of the curve decreases, which results in less contrast. The increased density value of the toe also indicates an increased fog level. This fog density occurs because more of the unexposed silver grains are developed by the excess processing.
| |
Under Processing | |
Under processing causes the curve to shift to the right, indicating a decrease in sensitivity. The shoulder also begins to drop, and the slope of a curve decreases. This results in less contrast and less density.
| |
FILM FOG | |
Any density in a film that is not produced as part of the image-forming exposure is generally referred to as fog. There are several potential sources of film fog.
| |
Inherent | |
All film, even under the best conditions, shows some density even if it has received no radiation exposure. This density comes from the film base and from the unexposed emulsion, and is the density observed if a piece of unexposed film is processed. This is typically referred to as the base plus fog density and is generally in the range of 0.15 to 0.2 density units for radiographic film.
| |
Chemical | |
If a film is over processed, abnormally high densities will be developed by chemical action in image areas that received little or no exposure. This results from chemicals in the developer solution interacting with some of the film grains that were not sensitized by exposure.
| |
Heat and Age | |
Fog will gradually develop in unprocessed film with age; therefore, film should not be stored for long periods of time. Each box of film is labeled with an expiration date by the manufacturer. When stored under proper conditions, film should not develop appreciable fog before the expiration date. When film is stored in a clinical facility, the stock should be rotated on a first-in, first-out basis.
The development of film fog with age is accelerated by heat; therefore, film should not be stored in hot areas. Refrigeration can extend the useful life of unprocessed film.
| |
Radiation Exposure | |
It is not uncommon for film to be fogged by accidental exposure to either x-radiation or light. Light-exposure fogging can result from light leaks in a darkroom, the use of incorrect safelights, and cassettes with defective light seals around the edges.
Film darkrooms and storage areas should be properly shielded from nearby x-ray sources. | |